
Event-related fMRI
Extracting the average time-series from one signal, time-locked to the occurrence of some type of event in another signal is a very typical operation in the analysis of time-series from neuroscience experiments. Therefore, we have an additional example of this kind of analysis in Auditory processing in grasshoppers
The following example is taken from an fMRI experiment in which a subject was viewing a motion stimulus, while fMRI BOLD was recorded. The time-series in this data set were extracted from motion-sensitive voxels near area MT (a region containing motion-sensitive cells) in this subject’s brain. 6 different kinds of trials could occur in this experiment (designating different directions and locations of motion). The following example shows the extraction of the time-dependent responses of the voxels in this region to the different stimuli.
We start by importing modules/functions used and define some variables we will use in the analysis:
import os

import numpy as np
import matplotlib.pyplot as plt

import nitime
import nitime.timeseries as ts
import nitime.analysis as nta
import nitime.viz as viz

TR = 2.
len_et = 15  # This is given in number of samples, not time!
Next, we load the data into an array from the csv file, using np.loadtxt
data_path = os.path.join(nitime.__path__[0], 'data')

fname = os.path.join(data_path, 'event_related_fmri.csv')

data = np.genfromtxt(fname, dtype=float, delimiter=',', names=True)
We initialize TimeSeries objects with the data and the TR:
One TimeSeries is initialized for the BOLD data:
t1 = ts.TimeSeries(data['bold'], sampling_interval=TR)
And another one for the events (the different stimuli):
t2 = ts.TimeSeries(data['events'], sampling_interval=TR)
Note that this example uses the EventRelated analyzer (also used in the
Auditory processing in grasshoppers example), but here, instead of providing an Events
object as input, another TimeSeries object is provided, containing an
equivalent time-series with the same dimensions as the time-series on which the
analysis is done, with ‘0’ wherever no event of interest occurred and an integer
wherever an even of interest occurred (sequential different integers for the
different kinds of events).
E = nta.EventRelatedAnalyzer(t1, t2, len_et)
Two different methods of the EventRelatedAnalyzer are used: E.eta
refers to the event-triggered average of the activity and E.ets refers
to the event-triggered standard error of the mean (where the degrees of freedom
are set by the number of trials). Note that you can also extract the
event-triggered data itself as a list, by referring instead to
E.et_data.
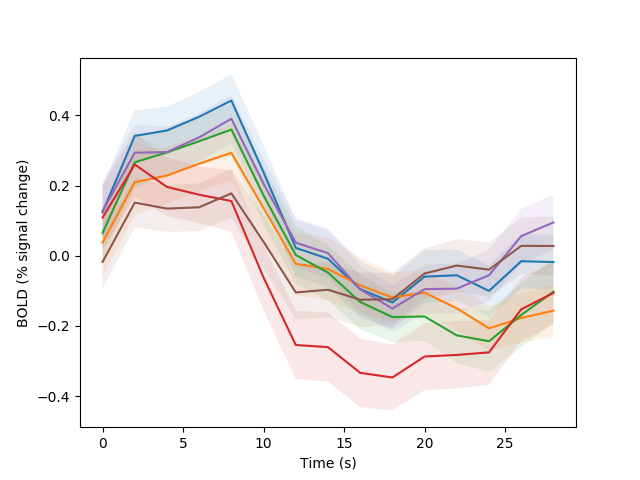
We pass the eta and ets calculations straight into the visualization function, which plots the result:
fig01 = viz.plot_tseries(E.eta, ylabel='BOLD (% signal change)', yerror=E.ets)
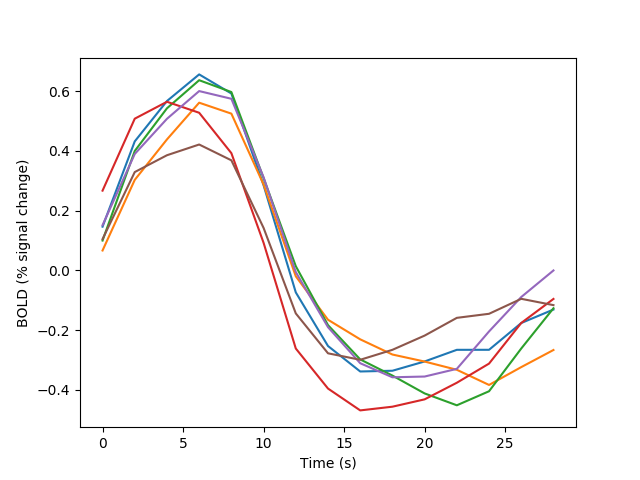
In the following example an alternative approach is taken to calculating the event-related activity, based on the finite impulse-response model (see [Burock2000] for details)
fig02 = viz.plot_tseries(E.FIR, ylabel='BOLD (% signal change)')
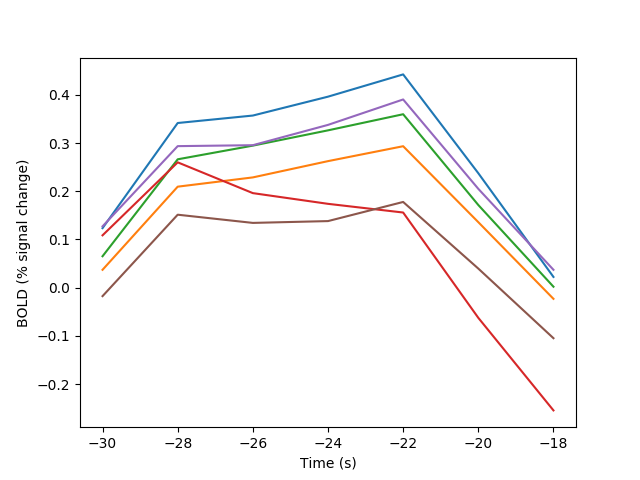
Yet another method is based on a cross-correlation performed in the frequency domain (thanks to Lavi Secundo for providing a previous implementation of this idea). This method can speed up calculation substantially for long time-series, because the calculation is done using a vector multiplication in the frequency domain representation of the time-series, instead of a more computationally expensive convolution-like operation
fig03 = viz.plot_tseries(E.xcorr_eta, ylabel='BOLD (% signal change)')
We call plt.show() in order to display all the figures:
plt.show()
| [Burock2000] | M.A. Burock and A.M.Dale (2000). Estimation and Detection of Event-Related fMRI Signals with Temporally Correlated Noise: A Statistically Efficient and Unbiased Approach. Human Brain Mapping, 11:249-260 |
Example source code
You can download the full source code of this example.
This same script is also included in the Nitime source distribution under the
doc/examples/ directory.