
labs.viz_tools.slicers
Module: labs.viz_tools.slicers
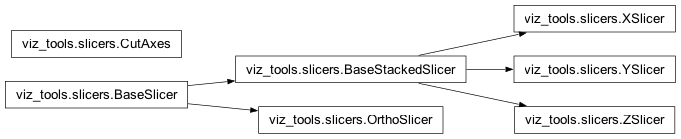
Inheritance diagram for nipy.labs.viz_tools.slicers:
The Slicer classes.
The main purpose of these classes is to have auto adjust of axes size to the data with different layout of cuts.
Classes
BaseSlicer
- class nipy.labs.viz_tools.slicers.BaseSlicer(cut_coords, axes=None, black_bg=False)
Bases:
objectThe main purpose of these class is to have auto adjust of axes size to the data with different layout of cuts.
- __init__(cut_coords, axes=None, black_bg=False)
Create 3 linked axes for plotting orthogonal cuts.
- Parameters:
- cut_coords: 3 tuple of ints
The cut position, in world space.
- axes: matplotlib axes object, optional
The axes that will be subdivided in 3.
- black_bg: boolean, optional
If True, the background of the figure will be put to black. If you wish to save figures with a black background, you will need to pass “facecolor=’k’, edgecolor=’k’” to pyplot’s savefig.
- annotate(left_right=True, positions=True, size=12, **kwargs)
Add annotations to the plot.
- Parameters:
- left_right: boolean, optional
If left_right is True, annotations indicating which side is left and which side is right are drawn.
- positions: boolean, optional
If positions is True, annotations indicating the positions of the cuts are drawn.
- size: integer, optional
The size of the text used.
- kwargs:
Extra keyword arguments are passed to matplotlib’s text function.
- contour_map(map, affine, **kwargs)
Contour a 3D map in all the views.
- Parameters:
- map: 3D ndarray
The 3D map to be plotted. If it is a masked array, only the non-masked part will be plotted.
- affine: 4x4 ndarray
The affine matrix giving the transformation from voxel indices to world space.
- kwargs:
Extra keyword arguments are passed to contour.
- edge_map(map, affine, color='r')
Plot the edges of a 3D map in all the views.
- Parameters:
- map: 3D ndarray
The 3D map to be plotted. If it is a masked array, only the non-masked part will be plotted.
- affine: 4x4 ndarray
The affine matrix giving the transformation from voxel indices to world space.
- color: matplotlib color: string or (r, g, b) value
The color used to display the edge map
- static find_cut_coords(data=None, affine=None, threshold=None, cut_coords=None)
- classmethod init_with_figure(data=None, affine=None, threshold=None, cut_coords=None, figure=None, axes=None, black_bg=False, leave_space=False)
- plot_map(map, affine, threshold=None, **kwargs)
Plot a 3D map in all the views.
- Parameters:
- map: 3D ndarray
The 3D map to be plotted. If it is a masked array, only the non-masked part will be plotted.
- affine: 4x4 ndarray
The affine matrix giving the transformation from voxel indices to world space.
- thresholda number, None, or ‘auto’
If None is given, the maps are not thresholded. If a number is given, it is used to threshold the maps: values below the threshold are plotted as transparent.
- kwargs:
Extra keyword arguments are passed to imshow.
- title(text, x=0.01, y=0.99, size=15, color=None, bgcolor=None, alpha=1, **kwargs)
Write a title to the view.
- Parameters:
- text: string
The text of the title
- x: float, optional
The horizontal position of the title on the frame in fraction of the frame width.
- y: float, optional
The vertical position of the title on the frame in fraction of the frame height.
- size: integer, optional
The size of the title text.
- color: matplotlib color specifier, optional
The color of the font of the title.
- bgcolor: matplotlib color specifier, optional
The color of the background of the title.
- alpha: float, optional
The alpha value for the background.
- kwargs:
Extra keyword arguments are passed to matplotlib’s text function.
BaseStackedSlicer
- class nipy.labs.viz_tools.slicers.BaseStackedSlicer(cut_coords, axes=None, black_bg=False)
Bases:
BaseSlicerA class to create linked axes for plotting stacked cuts of 3D maps.
Notes
The extent of the different axes are adjusted to fit the data best in the viewing area.
- Attributes:
- axes: dictionary of axes
The axes used to plot each view.
- frame_axes: axes
The axes framing the whole set of views.
- __init__(cut_coords, axes=None, black_bg=False)
Create 3 linked axes for plotting orthogonal cuts.
- Parameters:
- cut_coords: 3 tuple of ints
The cut position, in world space.
- axes: matplotlib axes object, optional
The axes that will be subdivided in 3.
- black_bg: boolean, optional
If True, the background of the figure will be put to black. If you wish to save figures with a black background, you will need to pass “facecolor=’k’, edgecolor=’k’” to pyplot’s savefig.
- annotate(left_right=True, positions=True, size=12, **kwargs)
Add annotations to the plot.
- Parameters:
- left_right: boolean, optional
If left_right is True, annotations indicating which side is left and which side is right are drawn.
- positions: boolean, optional
If positions is True, annotations indicating the positions of the cuts are drawn.
- size: integer, optional
The size of the text used.
- kwargs:
Extra keyword arguments are passed to matplotlib’s text function.
- contour_map(map, affine, **kwargs)
Contour a 3D map in all the views.
- Parameters:
- map: 3D ndarray
The 3D map to be plotted. If it is a masked array, only the non-masked part will be plotted.
- affine: 4x4 ndarray
The affine matrix giving the transformation from voxel indices to world space.
- kwargs:
Extra keyword arguments are passed to contour.
- draw_cross(cut_coords=None, **kwargs)
Draw a crossbar on the plot to show where the cut is performed.
- Parameters:
- cut_coords: 3-tuple of floats, optional
The position of the cross to draw. If none is passed, the ortho_slicer’s cut coordinates are used.
- kwargs:
Extra keyword arguments are passed to axhline
- edge_map(map, affine, color='r')
Plot the edges of a 3D map in all the views.
- Parameters:
- map: 3D ndarray
The 3D map to be plotted. If it is a masked array, only the non-masked part will be plotted.
- affine: 4x4 ndarray
The affine matrix giving the transformation from voxel indices to world space.
- color: matplotlib color: string or (r, g, b) value
The color used to display the edge map
- classmethod find_cut_coords(data=None, affine=None, threshold=None, cut_coords=None)
- classmethod init_with_figure(data=None, affine=None, threshold=None, cut_coords=None, figure=None, axes=None, black_bg=False, leave_space=False)
- plot_map(map, affine, threshold=None, **kwargs)
Plot a 3D map in all the views.
- Parameters:
- map: 3D ndarray
The 3D map to be plotted. If it is a masked array, only the non-masked part will be plotted.
- affine: 4x4 ndarray
The affine matrix giving the transformation from voxel indices to world space.
- thresholda number, None, or ‘auto’
If None is given, the maps are not thresholded. If a number is given, it is used to threshold the maps: values below the threshold are plotted as transparent.
- kwargs:
Extra keyword arguments are passed to imshow.
- title(text, x=0.01, y=0.99, size=15, color=None, bgcolor=None, alpha=1, **kwargs)
Write a title to the view.
- Parameters:
- text: string
The text of the title
- x: float, optional
The horizontal position of the title on the frame in fraction of the frame width.
- y: float, optional
The vertical position of the title on the frame in fraction of the frame height.
- size: integer, optional
The size of the title text.
- color: matplotlib color specifier, optional
The color of the font of the title.
- bgcolor: matplotlib color specifier, optional
The color of the background of the title.
- alpha: float, optional
The alpha value for the background.
- kwargs:
Extra keyword arguments are passed to matplotlib’s text function.
CutAxes
- class nipy.labs.viz_tools.slicers.CutAxes(ax, direction, coord)
Bases:
objectAn MPL axis-like object that displays a cut of 3D volumes
- __init__(ax, direction, coord)
An MPL axis-like object that displays a cut of 3D volumes
- Parameters:
- ax: a MPL axes instance
The axes in which the plots will be drawn
- direction: {‘x’, ‘y’, ‘z’}
The directions of the cut
- coord: float
The coordinate along the direction of the cut
- do_cut(map, affine)
Cut the 3D volume into a 2D slice
- Parameters:
- map: 3D ndarray
The 3D volume to cut
- affine: 4x4 ndarray
The affine of the volume
- draw_cut(cut, data_bounds, bounding_box, type='imshow', **kwargs)
- draw_left_right(size, bg_color, **kwargs)
- draw_position(size, bg_color, **kwargs)
- get_object_bounds()
Return the bounds of the objects on this axes.
OrthoSlicer
- class nipy.labs.viz_tools.slicers.OrthoSlicer(cut_coords, axes=None, black_bg=False)
Bases:
BaseSlicerA class to create 3 linked axes for plotting orthogonal cuts of 3D maps.
Notes
The extent of the different axes are adjusted to fit the data best in the viewing area.
- Attributes:
- axes: dictionary of axes
The 3 axes used to plot each view.
- frame_axes: axes
The axes framing the whole set of views.
- __init__(cut_coords, axes=None, black_bg=False)
Create 3 linked axes for plotting orthogonal cuts.
- Parameters:
- cut_coords: 3 tuple of ints
The cut position, in world space.
- axes: matplotlib axes object, optional
The axes that will be subdivided in 3.
- black_bg: boolean, optional
If True, the background of the figure will be put to black. If you wish to save figures with a black background, you will need to pass “facecolor=’k’, edgecolor=’k’” to pyplot’s savefig.
- annotate(left_right=True, positions=True, size=12, **kwargs)
Add annotations to the plot.
- Parameters:
- left_right: boolean, optional
If left_right is True, annotations indicating which side is left and which side is right are drawn.
- positions: boolean, optional
If positions is True, annotations indicating the positions of the cuts are drawn.
- size: integer, optional
The size of the text used.
- kwargs:
Extra keyword arguments are passed to matplotlib’s text function.
- contour_map(map, affine, **kwargs)
Contour a 3D map in all the views.
- Parameters:
- map: 3D ndarray
The 3D map to be plotted. If it is a masked array, only the non-masked part will be plotted.
- affine: 4x4 ndarray
The affine matrix giving the transformation from voxel indices to world space.
- kwargs:
Extra keyword arguments are passed to contour.
- draw_cross(cut_coords=None, **kwargs)
Draw a crossbar on the plot to show where the cut is performed.
- Parameters:
- cut_coords: 3-tuple of floats, optional
The position of the cross to draw. If none is passed, the ortho_slicer’s cut coordinates are used.
- kwargs:
Extra keyword arguments are passed to axhline
- edge_map(map, affine, color='r')
Plot the edges of a 3D map in all the views.
- Parameters:
- map: 3D ndarray
The 3D map to be plotted. If it is a masked array, only the non-masked part will be plotted.
- affine: 4x4 ndarray
The affine matrix giving the transformation from voxel indices to world space.
- color: matplotlib color: string or (r, g, b) value
The color used to display the edge map
- static find_cut_coords(data=None, affine=None, threshold=None, cut_coords=None)
- classmethod init_with_figure(data=None, affine=None, threshold=None, cut_coords=None, figure=None, axes=None, black_bg=False, leave_space=False)
- plot_map(map, affine, threshold=None, **kwargs)
Plot a 3D map in all the views.
- Parameters:
- map: 3D ndarray
The 3D map to be plotted. If it is a masked array, only the non-masked part will be plotted.
- affine: 4x4 ndarray
The affine matrix giving the transformation from voxel indices to world space.
- thresholda number, None, or ‘auto’
If None is given, the maps are not thresholded. If a number is given, it is used to threshold the maps: values below the threshold are plotted as transparent.
- kwargs:
Extra keyword arguments are passed to imshow.
- title(text, x=0.01, y=0.99, size=15, color=None, bgcolor=None, alpha=1, **kwargs)
Write a title to the view.
- Parameters:
- text: string
The text of the title
- x: float, optional
The horizontal position of the title on the frame in fraction of the frame width.
- y: float, optional
The vertical position of the title on the frame in fraction of the frame height.
- size: integer, optional
The size of the title text.
- color: matplotlib color specifier, optional
The color of the font of the title.
- bgcolor: matplotlib color specifier, optional
The color of the background of the title.
- alpha: float, optional
The alpha value for the background.
- kwargs:
Extra keyword arguments are passed to matplotlib’s text function.
XSlicer
- class nipy.labs.viz_tools.slicers.XSlicer(cut_coords, axes=None, black_bg=False)
Bases:
BaseStackedSlicer- __init__(cut_coords, axes=None, black_bg=False)
Create 3 linked axes for plotting orthogonal cuts.
- Parameters:
- cut_coords: 3 tuple of ints
The cut position, in world space.
- axes: matplotlib axes object, optional
The axes that will be subdivided in 3.
- black_bg: boolean, optional
If True, the background of the figure will be put to black. If you wish to save figures with a black background, you will need to pass “facecolor=’k’, edgecolor=’k’” to pyplot’s savefig.
- annotate(left_right=True, positions=True, size=12, **kwargs)
Add annotations to the plot.
- Parameters:
- left_right: boolean, optional
If left_right is True, annotations indicating which side is left and which side is right are drawn.
- positions: boolean, optional
If positions is True, annotations indicating the positions of the cuts are drawn.
- size: integer, optional
The size of the text used.
- kwargs:
Extra keyword arguments are passed to matplotlib’s text function.
- contour_map(map, affine, **kwargs)
Contour a 3D map in all the views.
- Parameters:
- map: 3D ndarray
The 3D map to be plotted. If it is a masked array, only the non-masked part will be plotted.
- affine: 4x4 ndarray
The affine matrix giving the transformation from voxel indices to world space.
- kwargs:
Extra keyword arguments are passed to contour.
- draw_cross(cut_coords=None, **kwargs)
Draw a crossbar on the plot to show where the cut is performed.
- Parameters:
- cut_coords: 3-tuple of floats, optional
The position of the cross to draw. If none is passed, the ortho_slicer’s cut coordinates are used.
- kwargs:
Extra keyword arguments are passed to axhline
- edge_map(map, affine, color='r')
Plot the edges of a 3D map in all the views.
- Parameters:
- map: 3D ndarray
The 3D map to be plotted. If it is a masked array, only the non-masked part will be plotted.
- affine: 4x4 ndarray
The affine matrix giving the transformation from voxel indices to world space.
- color: matplotlib color: string or (r, g, b) value
The color used to display the edge map
- classmethod find_cut_coords(data=None, affine=None, threshold=None, cut_coords=None)
- classmethod init_with_figure(data=None, affine=None, threshold=None, cut_coords=None, figure=None, axes=None, black_bg=False, leave_space=False)
- plot_map(map, affine, threshold=None, **kwargs)
Plot a 3D map in all the views.
- Parameters:
- map: 3D ndarray
The 3D map to be plotted. If it is a masked array, only the non-masked part will be plotted.
- affine: 4x4 ndarray
The affine matrix giving the transformation from voxel indices to world space.
- thresholda number, None, or ‘auto’
If None is given, the maps are not thresholded. If a number is given, it is used to threshold the maps: values below the threshold are plotted as transparent.
- kwargs:
Extra keyword arguments are passed to imshow.
- title(text, x=0.01, y=0.99, size=15, color=None, bgcolor=None, alpha=1, **kwargs)
Write a title to the view.
- Parameters:
- text: string
The text of the title
- x: float, optional
The horizontal position of the title on the frame in fraction of the frame width.
- y: float, optional
The vertical position of the title on the frame in fraction of the frame height.
- size: integer, optional
The size of the title text.
- color: matplotlib color specifier, optional
The color of the font of the title.
- bgcolor: matplotlib color specifier, optional
The color of the background of the title.
- alpha: float, optional
The alpha value for the background.
- kwargs:
Extra keyword arguments are passed to matplotlib’s text function.
YSlicer
- class nipy.labs.viz_tools.slicers.YSlicer(cut_coords, axes=None, black_bg=False)
Bases:
BaseStackedSlicer- __init__(cut_coords, axes=None, black_bg=False)
Create 3 linked axes for plotting orthogonal cuts.
- Parameters:
- cut_coords: 3 tuple of ints
The cut position, in world space.
- axes: matplotlib axes object, optional
The axes that will be subdivided in 3.
- black_bg: boolean, optional
If True, the background of the figure will be put to black. If you wish to save figures with a black background, you will need to pass “facecolor=’k’, edgecolor=’k’” to pyplot’s savefig.
- annotate(left_right=True, positions=True, size=12, **kwargs)
Add annotations to the plot.
- Parameters:
- left_right: boolean, optional
If left_right is True, annotations indicating which side is left and which side is right are drawn.
- positions: boolean, optional
If positions is True, annotations indicating the positions of the cuts are drawn.
- size: integer, optional
The size of the text used.
- kwargs:
Extra keyword arguments are passed to matplotlib’s text function.
- contour_map(map, affine, **kwargs)
Contour a 3D map in all the views.
- Parameters:
- map: 3D ndarray
The 3D map to be plotted. If it is a masked array, only the non-masked part will be plotted.
- affine: 4x4 ndarray
The affine matrix giving the transformation from voxel indices to world space.
- kwargs:
Extra keyword arguments are passed to contour.
- draw_cross(cut_coords=None, **kwargs)
Draw a crossbar on the plot to show where the cut is performed.
- Parameters:
- cut_coords: 3-tuple of floats, optional
The position of the cross to draw. If none is passed, the ortho_slicer’s cut coordinates are used.
- kwargs:
Extra keyword arguments are passed to axhline
- edge_map(map, affine, color='r')
Plot the edges of a 3D map in all the views.
- Parameters:
- map: 3D ndarray
The 3D map to be plotted. If it is a masked array, only the non-masked part will be plotted.
- affine: 4x4 ndarray
The affine matrix giving the transformation from voxel indices to world space.
- color: matplotlib color: string or (r, g, b) value
The color used to display the edge map
- classmethod find_cut_coords(data=None, affine=None, threshold=None, cut_coords=None)
- classmethod init_with_figure(data=None, affine=None, threshold=None, cut_coords=None, figure=None, axes=None, black_bg=False, leave_space=False)
- plot_map(map, affine, threshold=None, **kwargs)
Plot a 3D map in all the views.
- Parameters:
- map: 3D ndarray
The 3D map to be plotted. If it is a masked array, only the non-masked part will be plotted.
- affine: 4x4 ndarray
The affine matrix giving the transformation from voxel indices to world space.
- thresholda number, None, or ‘auto’
If None is given, the maps are not thresholded. If a number is given, it is used to threshold the maps: values below the threshold are plotted as transparent.
- kwargs:
Extra keyword arguments are passed to imshow.
- title(text, x=0.01, y=0.99, size=15, color=None, bgcolor=None, alpha=1, **kwargs)
Write a title to the view.
- Parameters:
- text: string
The text of the title
- x: float, optional
The horizontal position of the title on the frame in fraction of the frame width.
- y: float, optional
The vertical position of the title on the frame in fraction of the frame height.
- size: integer, optional
The size of the title text.
- color: matplotlib color specifier, optional
The color of the font of the title.
- bgcolor: matplotlib color specifier, optional
The color of the background of the title.
- alpha: float, optional
The alpha value for the background.
- kwargs:
Extra keyword arguments are passed to matplotlib’s text function.
ZSlicer
- class nipy.labs.viz_tools.slicers.ZSlicer(cut_coords, axes=None, black_bg=False)
Bases:
BaseStackedSlicer- __init__(cut_coords, axes=None, black_bg=False)
Create 3 linked axes for plotting orthogonal cuts.
- Parameters:
- cut_coords: 3 tuple of ints
The cut position, in world space.
- axes: matplotlib axes object, optional
The axes that will be subdivided in 3.
- black_bg: boolean, optional
If True, the background of the figure will be put to black. If you wish to save figures with a black background, you will need to pass “facecolor=’k’, edgecolor=’k’” to pyplot’s savefig.
- annotate(left_right=True, positions=True, size=12, **kwargs)
Add annotations to the plot.
- Parameters:
- left_right: boolean, optional
If left_right is True, annotations indicating which side is left and which side is right are drawn.
- positions: boolean, optional
If positions is True, annotations indicating the positions of the cuts are drawn.
- size: integer, optional
The size of the text used.
- kwargs:
Extra keyword arguments are passed to matplotlib’s text function.
- contour_map(map, affine, **kwargs)
Contour a 3D map in all the views.
- Parameters:
- map: 3D ndarray
The 3D map to be plotted. If it is a masked array, only the non-masked part will be plotted.
- affine: 4x4 ndarray
The affine matrix giving the transformation from voxel indices to world space.
- kwargs:
Extra keyword arguments are passed to contour.
- draw_cross(cut_coords=None, **kwargs)
Draw a crossbar on the plot to show where the cut is performed.
- Parameters:
- cut_coords: 3-tuple of floats, optional
The position of the cross to draw. If none is passed, the ortho_slicer’s cut coordinates are used.
- kwargs:
Extra keyword arguments are passed to axhline
- edge_map(map, affine, color='r')
Plot the edges of a 3D map in all the views.
- Parameters:
- map: 3D ndarray
The 3D map to be plotted. If it is a masked array, only the non-masked part will be plotted.
- affine: 4x4 ndarray
The affine matrix giving the transformation from voxel indices to world space.
- color: matplotlib color: string or (r, g, b) value
The color used to display the edge map
- classmethod find_cut_coords(data=None, affine=None, threshold=None, cut_coords=None)
- classmethod init_with_figure(data=None, affine=None, threshold=None, cut_coords=None, figure=None, axes=None, black_bg=False, leave_space=False)
- plot_map(map, affine, threshold=None, **kwargs)
Plot a 3D map in all the views.
- Parameters:
- map: 3D ndarray
The 3D map to be plotted. If it is a masked array, only the non-masked part will be plotted.
- affine: 4x4 ndarray
The affine matrix giving the transformation from voxel indices to world space.
- thresholda number, None, or ‘auto’
If None is given, the maps are not thresholded. If a number is given, it is used to threshold the maps: values below the threshold are plotted as transparent.
- kwargs:
Extra keyword arguments are passed to imshow.
- title(text, x=0.01, y=0.99, size=15, color=None, bgcolor=None, alpha=1, **kwargs)
Write a title to the view.
- Parameters:
- text: string
The text of the title
- x: float, optional
The horizontal position of the title on the frame in fraction of the frame width.
- y: float, optional
The vertical position of the title on the frame in fraction of the frame height.
- size: integer, optional
The size of the title text.
- color: matplotlib color specifier, optional
The color of the font of the title.
- bgcolor: matplotlib color specifier, optional
The color of the background of the title.
- alpha: float, optional
The alpha value for the background.
- kwargs:
Extra keyword arguments are passed to matplotlib’s text function.
Function
- nipy.labs.viz_tools.slicers.demo_ortho_slicer()
A small demo of the OrthoSlicer functionality.