
Empirical null
The nipy.algorithms.statistics.empirical_pvalue module contains a class
that fits a Gaussian model to the central part of an histogram, following
Schwartzman et al, 2009. This is typically necessary to estimate a FDR when one
is not certain that the data behaves as a standard normal under H_0.
The NormalEmpiricalNull class learns its null distribution on the data
provided at initialisation. Two different methods can be used to set a threshold
from the null distribution: the NormalEmpiricalNull.threshold() method
returns the threshold for a given false discovery rate, and thus accounts for
multiple comparisons with the given dataset; the
NormalEmpiricalNull.uncorrected_threshold() returns the threshold for a
given uncorrected p-value, and as such does not account for multiple
comparisons.
Example
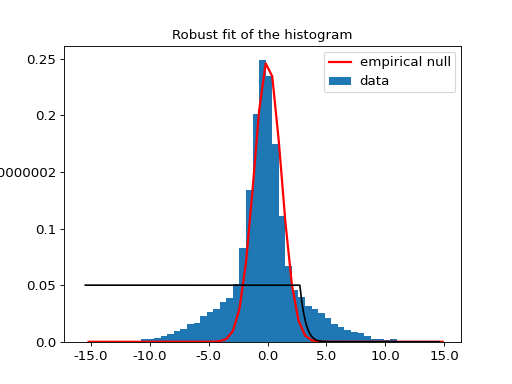
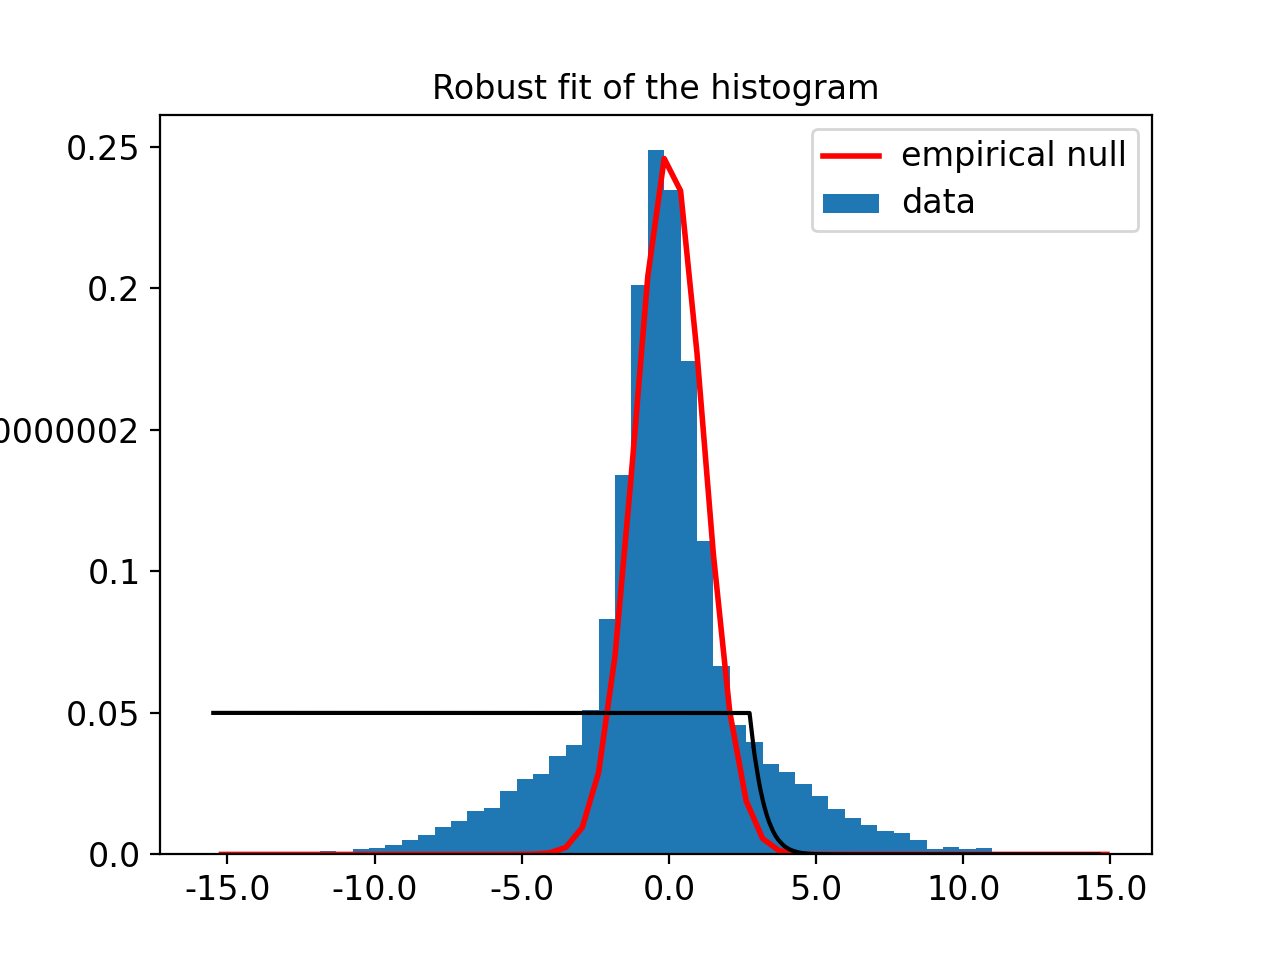
If we use the empirical normal null estimator on a two Gaussian mixture distribution, with a central Gaussian, and a wide one, it uses the central distribution as a null hypothesis, and returns the threshold following which the data can be claimed to belong to the wide Gaussian:
# emacs: -*- mode: python; py-indent-offset: 4; indent-tabs-mode: nil -*-
# vi: set ft=python sts=4 ts=4 sw=4 et:
import numpy as np

from nipy.algorithms.statistics.empirical_pvalue import NormalEmpiricalNull

x = np.c_[np.random.normal(size=10000),
          np.random.normal(scale=4, size=10000)]

enn = NormalEmpiricalNull(x)
enn.threshold(verbose=True)
(Source code, png, hires.png, pdf)

The threshold evaluated with the NormalEmpiricalNull.threshold() method is
around 2.8 (using the default p-value of 0.05). The
NormalEmpiricalNull.uncorrected_threshold() returns, for the same p-value,
a threshold of 1.9. It is necessary to use a higher p-value with uncorrected
comparisons.
Class documentation
- class nipy.algorithms.statistics.empirical_pvalue.NormalEmpiricalNull(x)
Class to compute the empirical null normal fit to the data.
The data which is used to estimate the FDR, assuming a Gaussian null from Schwartzmann et al., NeuroImage 44 (2009) 71–82
- __init__(x)
Initialize an empirical null normal object.
- Parameters:
- x1D ndarray
The data used to estimate the empirical null.
- fdr(theta)
Given a threshold theta, find the estimated FDR
- Parameters:
- thetafloat or array of shape (n_samples)
values to test
- Returns:
- afpvalue of array of shape(n)
- fdrcurve()
Returns the FDR associated with any point of self.x
- learn(left=0.2, right=0.8)
Estimate the proportion, mean and variance of a Gaussian distribution for a fraction of the data
- Parameters:
- left: float, optional
Left cut parameter to prevent fitting non-gaussian data
- right: float, optional
Right cut parameter to prevent fitting non-gaussian data
Notes
This method stores the following attributes:
mu = mu
p0 = min(1, np.exp(lp0))
sqsigma: variance of the estimated normal distribution
sigma: np.sqrt(sqsigma) : standard deviation of the estimated normal distribution
- plot(efp=None, alpha=0.05, bar=1, mpaxes=None)
Plot the histogram of x
- Parameters:
- efpfloat, optional
The empirical FDR (corresponding to x) if efp==None, the false positive rate threshold plot is not drawn.
- alphafloat, optional
The chosen FDR threshold
- bar=1bool, optional
- mpaxes=None: if not None, handle to an axes where the fig
- will be drawn. Avoids creating unnecessarily new figures
- threshold(alpha=0.05, verbose=0)
Compute the threshold corresponding to an alpha-level FDR for x
- Parameters:
- alphafloat, optional
the chosen false discovery rate threshold.
- verboseboolean, optional
the verbosity level, if True a plot is generated.
- Returns:
- theta: float
the critical value associated with the provided FDR
- uncorrected_threshold(alpha=0.001, verbose=0)
Compute the threshold corresponding to a specificity alpha for x
- Parameters:
- alphafloat, optional
the chosen false discovery rate (FDR) threshold.
- verboseboolean, optional
the verbosity level, if True a plot is generated.
- Returns:
- theta: float
the critical value associated with the provided p-value
Reference: Schwartzmann et al., NeuroImage 44 (2009) 71–82